Hydraulikk/Mjøsa

Water quality in Lake Mjøsa during the 1995 flood
In the spring of 1995 there was a large flood in the rivers flowing into
Lake Mjøsa in Norway. The flood caused extensive damage by
submerging houses and infrastructure by the lake. There was also concern
about the water quality in the lake during the flood, as the lake water
was used in the water supply for many of the villages around the lake.
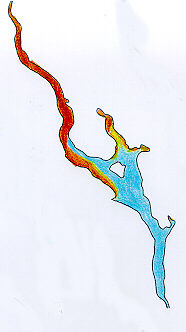
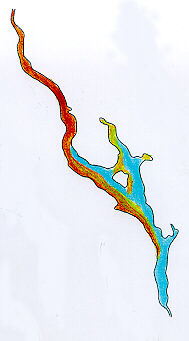
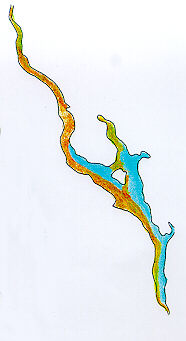
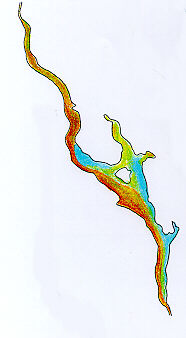
Lake Mjøsa is the largest lake in Norway. The modelled part of
the lake is approximately 60 km long and has a maximum depth of 400
meters. The bathymetry of the lake is shown in the figure below.
The colours show the depth, where blue is the largest depth, and
red is the smallest depth.
The SSIIM
model was used for the CFD calculations. The lake was modelled with an
unstructured grid with hexahedral cells. The grid is seen from above in the
figure below:
A detail of the grid is shown below:
The water flow in the lake was calculated based on recorded inflow and outflow.
The flood started on the 27th of May 1998, when the water discharge increased
from 300 qm/s to 600 qm/s. It increased steadily to 2885 qm/s on the 3rd of May,
before decreasing slowly. It was assumed that the water quality deterioration
started simultaneously with the flood increase.
The Norwegian Institute for Water Research
measured the water quality in the lake during the flood. Several parameters were
measured. Colour maps based on the measured turbidity was made. These are presented
below. The turbidity was also calculated by solving the transient convection-diffusion
equation. The calculated results are presented together with the measurements below:
Calculated (left) and measured (right) turbidity at the water surface at
6th of June 1995.
Calculated (left) and measured (right) turbidity at the water surface at
9th of June 1995.
Calculated (left) and measured (right) turbidity at the water surface at
12th of June 1995.
Calculated (left) and measured (right) turbidity at the water surface at
15th of June 1995.

The animation above shows the bed and the surface of the computational grid,
with a vertical profile at the upstream part of the lake. The colors show the
turbidity concentration at 15. June. The final profile in the animation shows
that the contaminated flood water is confined to the layer close to the water
surface. This is due to the temperature stratification of the lake. The water
intakes to the main towns around the lake, for example Lillehammer and Hamar,
are located at in the deeper parts of the lake. The low quality of the flood
water therefore had less effect on the water supply for the local population.
Measurements of the vertical profiles also showed this effect.
This project is carried out in cooperation with Gøsta Kjellberg
at The Norwegian Institute for Water Research
The Norwegian Research Council is partly sponsoring this project.
Back to CFD page
This page is made by
Nils
Reidar B. Olsen
Copyright © 2000, Institutt
for Vassbygging, NTNU